Exploratory Data Analysis for Process Optimization in the Radiology Department of the University Hospital Basel
The department of radiology of the University Hospital Basel collects time-stamped data like ad- mission, length of stay (LOS), intervention (scan day), as well as modality and other patient associated demographic parameters. Medical imaging is considered as one of the most important biomarkers: It determines diagnosis, treatment and predicts the outcome of patients. Furthermore the diagnosis enables to prevent prolonged LOS and to improve clinical care and efficiency. An interactive visualization of data helps the analysts to validate their experiences and generate new insight. This thesis seeks to develop such an interactive visualization application.
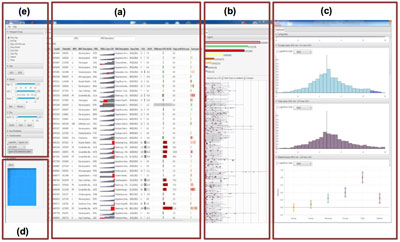
The hospital manages about 35’000 visits annually. More than one third needs at least one diagnostic by the RD. Overall about 27’000 visits at the RD with over 75’000 scan interventions are found in 2014 and 2015. This master thesis enables the preparation and import of different data sources into one database and provides a single interface for the application. More precisely, a new developed application offers mainly three views using sorting and filtering functions: The Attribute-View gives an overview of the attributes of the visits showing small embedded charts. The Chronological-Scan-View visualizes the visits and its scans during a stay. The Distribution-View clusters visits into groups in order to compare their distributions and median values.
In average, one visit including radiology intervention records 2.5 scans. The Attribute-View and the Chronological-Scan-View compare detailed information of the visits and highlight outliers and exceptions without losing the context. The two views demonstrate the large variance of the data. All the more the filter and sorting functions are important to explore sub-group of visits interactively. The views identify process patterns of scans over time for specific disease groups. The new findings answer some hypotheses of the analysts for improving the process in the RD.
Together with statistic tools and the Distribution-View an inhomogeneous distribution of the admitted visits during the week was detected (p<0.01) with a higher registration at the beginning of the week. Also a significant higher LOS was shown for visits admitting on Friday (p<0.05). Additionally the first scan was conducted in most cases (58%) on admission day. A conduction of the first scan on the third residence day increased LOS significantly compared to the conduction of the first scan on the second day (p<0.05).
The application that was developed enables to explore visualized data and provides a tool to analyze with interactive functions. This visualization provides a broader view of the collected time-stamped data with the possibility to focus on specific groups. This supports developing new hypotheses. The implemented architecture of the application allows adding new functionalities to follow new hypotheses.